Logistic回归(鸢尾花分类)
导入模块
import numpy as np
import matplotlib.pyplot as plt
from matplotlib.colors import ListedColormap
from matplotlib.font_manager import FontProperties
from sklearn import datasets
from sklearn.linear_model import LogisticRegression
%matplotlib inline
font = FontProperties(fname='/Library/Fonts/Heiti.ttc')
获取数据
iris_data = datasets.load_iris()
X = iris_data.data[:, [2, 3]]
y = iris_data.target
label_list = ['山鸢尾', '杂色鸢尾', '维吉尼亚鸢尾']
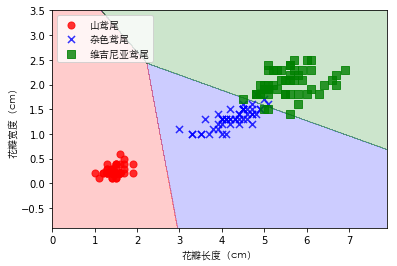
构建决策边界
def plot_decision_regions(X, y, classifier=None):
    marker_list = ['o', 'x', 's']
    color_list = ['r', 'b', 'g']
    cmap = ListedColormap(color_list[:len(np.unique(y))])

    x1_min, x1_max = X[:, 0].min()-1, X[:, 0].max()+1
    x2_min, x2_max = X[:, 1].min()-1, X[:, 1].max()+1
    t1 = np.linspace(x1_min, x1_max, 666)
    t2 = np.linspace(x2_min, x2_max, 666)

    x1, x2 = np.meshgrid(t1, t2)
    y_hat = classifier.predict(np.array([x1.ravel(), x2.ravel()]).T)
    y_hat = y_hat.reshape(x1.shape)
    plt.contourf(x1, x2, y_hat, alpha=0.2, cmap=cmap)
    plt.xlim(x1_min, x1_max)
    plt.ylim(x2_min, x2_max)

    for ind, clas in enumerate(np.unique(y)):
        plt.scatter(X[y == clas, 0], X[y == clas, 1], alpha=0.8, s=50,
                    c=color_list[ind], marker=marker_list[ind], label=label_list[clas])
训练模型
# C与正则化参数λ成反比,即减小参数C增大正则化的强度
# lbfgs使用拟牛顿法优化参数
# 分类方式为OvR(One-vs-Rest)
lr = LogisticRegression(C=100, random_state=1,
                        solver='lbfgs', multi_class='ovr')
lr.fit(X, y)
LogisticRegression(C=100, class_weight=None, dual=False, fit_intercept=True,
          intercept_scaling=1, max_iter=100, multi_class='ovr',
          n_jobs=None, penalty='l2', random_state=1, solver='lbfgs',
          tol=0.0001, verbose=0, warm_start=False)
C参数与权重系数的关系

